"Gwangmyeong Home Prices Now Just Below Seoul"...Regional Price Catch-Up
- Input
- 2026-09-14 09:30:29
- Updated
- 2026-09-14 09:30:29
[Financial News] A so-called home-price “catch-up” pattern has recently emerged in the Seoul metropolitan apartment market, with price trends diverging by region. As areas where prices rose sharply are followed by relatively more affordable areas posting further gains, price gaps between regions are narrowing.
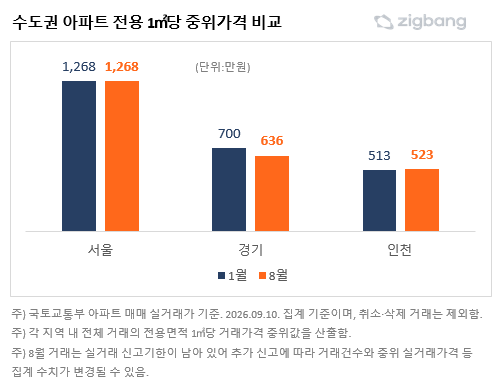
According to an analysis released on the 14th by real estate platform Zigbang, based on apartment sales transaction data from the Ministry of Land, Infrastructure and Transport (MOLIT), the median transaction price per exclusive-use square meter for apartments in Seoul was 12.68 million won in January this year and remained the same at 12.68 million won in August. However, August transactions are still within the reporting period, so the figure may change as additional transactions are reported.
In Seoul, several non-Gangnam areas, including Seongbuk District, Dongdaemun District and Jungnang-gu, posted notable gains. Seongbuk District’s median transaction price per square meter rose from 11.46 million won in January to 12.60 million won in August. Relative to Seoul’s overall price, it increased from 0.90 times to 0.99 times. In other words, it was about 90% of Seoul’s price in January but had nearly reached 99% by August.
Dongdaemun District rose from 12.18 million won to 13 million won over the same period, increasing from 0.96 times Seoul’s price to 1.03 times. Gangseo District also climbed from 12.39 million won to 13.36 million won, raising its ratio to Seoul from 0.98 times to 1.05 times.
Jungnang-gu and Nowon District remained less expensive than Seoul overall but narrowed the gap. Jungnang-gu rose from 9.36 million won to 11.63 million won, increasing from 0.74 times Seoul’s price to 0.92 times. Nowon District climbed from 10.04 million won to 11.17 million won, rising from 0.79 times to 0.88 times.
Existing high-priced areas widened their gap with Seoul’s average. Gangnam-gu rose from 2.41 times Seoul’s overall price to 2.69 times, while Seocho District increased from 1.68 times to 1.95 times. Songpa District also climbed from 1.74 times to 1.99 times, and Seongdong District from 1.69 times to 1.93 times. Thus, some relatively affordable non-Gangnam areas followed Seoul’s average, while high-priced areas such as the Gangnam Three Districts and Seongdong continued to rise.
In Gyeonggi Province, Gwangmyeong City and Yongin-si’s Suji District notably narrowed their price gaps with Seoul.
Gwangmyeong City’s median transaction price per square meter rose from 11.10 million won in January to 12.97 million won in August. Its price level relative to Seoul increased from 0.88 times to 1.02 times, slightly exceeding Seoul’s overall price in August. Yongin-si’s Suji District also rose from 9.54 million won to 11.10 million won. Its price increased from 75% of Seoul’s level to 88%.
Yongin-si’s Suji District likewise saw its median transaction price per square meter rise from 9.54 million won to 11.10 million won. Compared with Seoul, the ratio increased from 0.75 times to 0.88 times, meaning that a price level equivalent to about 75% of Seoul’s rose to 88%.
Strength in existing high-priced areas also continued. Hanam City rose from 12.95 million won to 14.48 million won, increasing from 1.02 times Seoul’s price to 1.14 times. Seongnam-si’s Bundang District climbed from 20.51 million won to 21.68 million won, rising from 1.62 times to 1.71 times.
Hwaseong City’s Dongtan District rose from 0.75 times Seoul’s price to 0.77 times, Suwon-si’s Gwonseon District from 0.50 times to 0.55 times, and Osan from 0.33 times to 0.41 times.
In Incheon Metropolitan City, Yeonsu-gu showed a particularly notable change. Its median transaction price per square meter rose from 6.54 million won in January to 7.53 million won in August. Its price level relative to Seoul also increased from 0.52 times to 0.59 times.
Geomdan-gu posted a modest increase from 5.92 million won to 6.08 million won, raising its ratio to Seoul from 0.47 times to 0.48 times. Incheon Metropolitan City’s overall median transaction price also rose from 5.13 million won to 5.23 million won over the same period.
Kim Eun-sun, head of Zigbang’s Big Data Lab, said, "The changes identified in this analysis should be viewed not as Seoul metropolitan-area home prices converging broadly toward similar levels, but as a process in which relative price positions measured against Seoul are being readjusted as price trends differ by region."
[email protected] Choi A-young Reporter