92.1% of the population lives in urban areas, which account for 16.7% of the national land area; population concentration is clear
- Input
- 2026-08-20 06:00:00
- Updated
- 2026-08-20 06:00:00
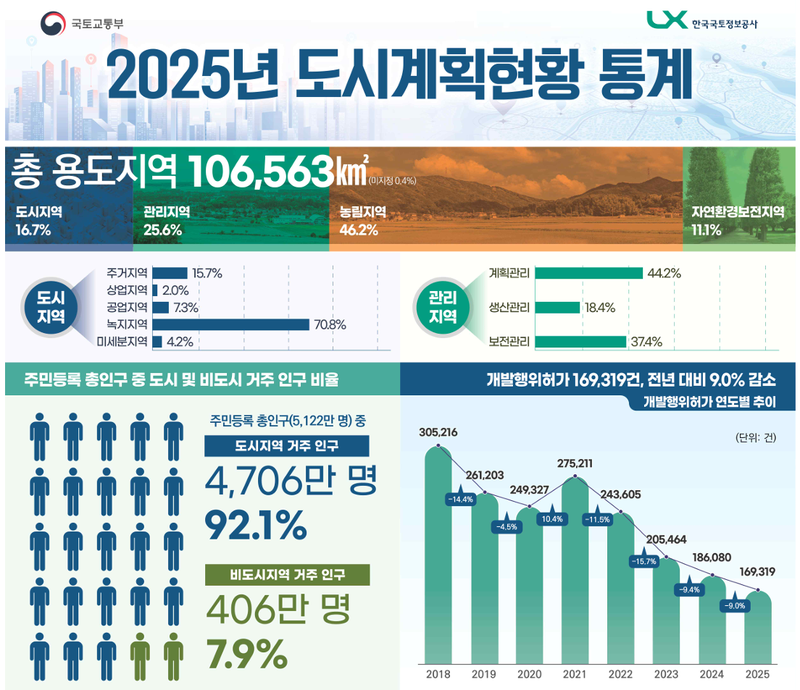
According to the Ministry of Land, Infrastructure and Transport and the Korea Land and Geospatial InformatiX Corporation (LX) on the 20th, the total land area designated as land-use zones stood at 106,563 square kilometers at the end of 2025. Of that, urban areas covered 17,740 square kilometers, or 16.7% of the total.
Of the country's total registered population of 51.12 million, 47.06 million people lived in urban areas, or 92.1%. The figures show that although urban areas account for only about one-sixth of the country's land, they are where most of the population is concentrated.
Within urban areas, green zones accounted for 12,555 square kilometers, or 70.8%, followed by residential areas at 2,791 square kilometers (15.7%), industrial areas at 1,292 square kilometers (7.3%), unspecified zones at 753 square kilometers (4.2%) and commercial areas at 349 square kilometers (2.0%).
Compared with 2021, residential and industrial areas each expanded by 51 square kilometers, while commercial areas increased by 7 square kilometers. Green zones shrank by 37 square kilometers, or 0.3%. Green space still made up the largest share of urban areas, but residential, commercial and industrial zones all expanded.
As of the end of last year, growth management planning zones, which are intended to prevent disorderly development in non-urbanized areas, totaled 13,801 locations covering 4,692 square kilometers. The designated area has continued to grow sharply since growth management planning became mandatory when factories are built in planned management areas from January 2024.
Development permits totaled 169,319, showing a declining trend over the past five years. Construction of buildings accounted for 84,618 cases, or about half of the total, followed by 47,938 cases for land alteration and 24,418 cases for installation of structures.
Urban and county planning facilities numbered 369,000 and covered 7,237 square kilometers. Long-delayed urban and county planning facilities that had not been implemented for more than 10 years covered 315 square kilometers, down 7.4% from a year earlier.
Unimplemented facilities accounted for 427 square kilometers, or 5.9% of all urban and county planning facilities. Over the past five years, both the designated area and the implemented area of urban and county planning facilities have increased, while the unimplemented area has continued to decline.
The statistics are nationally approved data compiled each year on land-use zones, development permits and the status of urban and county planning facilities managed by local governments. They are used as basic data for a wide range of fields, including urban policy making. Detailed figures can be checked on Landeum and Index.go.kr from the 20th.
[email protected] Jang In-seo Reporter