Households Grow Wealthier, Per Capita Reaches 274.75 Million Won, While National Wealth Growth Stalls
- Input
- 2026-07-22 12:00:00
- Updated
- 2026-07-22 12:00:00

■Per Capita Net Assets Up 9.1%According to the '2025 National Balance Sheet (provisional)' released by the Bank of Korea on the 22nd, per capita household net assets in South Korea were estimated at 274.75 million won at the end of last year. The figure was calculated by dividing household and nonprofit institutions' net assets of 1,420 trillion won by the estimated population of 51.68 million at the same point in time. It marked a 9.1% increase, or 22.91 million won, from the previous year's 251.84 million won, and the pace of growth widened more than threefold from 3.0%.
As this is only an arithmetic average, however, it is difficult to determine whether household assets rose evenly.
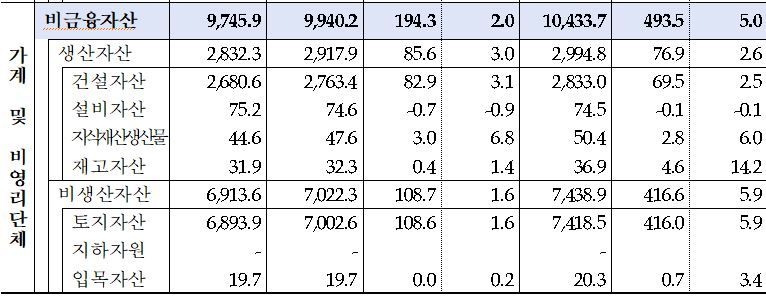
In fact, the real estate market, including land and housing, expanded significantly. At the end of last year, the market value of land reached 1,266 trillion won, up 4.6%, or 55.4 trillion won, from a year earlier. The pace of increase also widened more than 2.5 times from 1.8%. Seoul ranked first with 450.7 trillion won, followed by Gyeonggi Province with 349.2 trillion won, and the capital region accounted for 63.2% of the total. Incheon, with 58 trillion won, and Busan, with 56.2 trillion won, followed.
The market value of housing, at 771 trillion won, also rose 8.0%, or 57.1 trillion won, during the same period. The growth rate more than doubled from 3.9%. Seoul and Gyeonggi Province together accounted for 66.0% of the total, with 289.4 trillion won and 219.2 trillion won, respectively. Busan, with 39.8 trillion won, and Incheon, with 34.1 trillion won, came next.
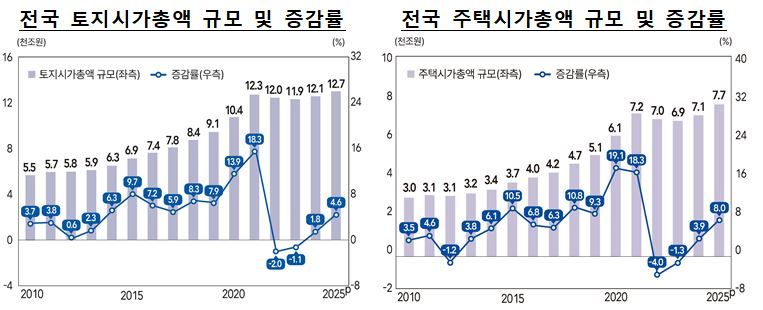
As a result, real estate assets rose 4.1%, or 70.9 trillion won, from a year earlier to 1,783.6 trillion won. Their share of nonfinancial assets climbed 0.3 percentage point to 76.6% from 76.3% at the end of the previous year.
Nam Min-ho, head of the National B/S Team at the Bank of Korea's Economic Statistics Department 2, explained, "Real estate prices surged sharply during the COVID-19 period in 2020, then fell before rising again. Although broad real estate measures were announced, housing price growth has remained high, so their impact does not appear to have been significant."
Another major factor was the boom in the domestic stock market. Net financial assets of the household and nonprofit institutions sector rose to 3,767 trillion won, up 21.8%, or 67.4 trillion won, from the end of the previous year. That was the largest increase since 2009, when the figure rose 26.5%.
Converted at last year's market exchange rate of 1,422 won per dollar, per capita household net assets came to $193,000. Compared with other major countries, the figure lagged behind the United States at $514,000, Australia at $420,000, Canada at $297,000, and Germany at $267,000, but it was slightly higher than Japan's $172,000.
When calculated on a per-household basis, household net assets at the end of last year were provisionally estimated at 634.27 million won. That was up 7.9%, or 46.66 million won, from 587.61 million won a year earlier, and the pace of increase widened nearly fourfold from 2.1%. Converted at the market exchange rate, the figure was $446,000.
■National Wealth Growth SlowsNational net assets, which represent the assets held by all economic agents and are commonly referred to as national wealth, stood at 24,561 trillion won. That was up 2.2%, or 53.1 trillion won, from the end of the previous year. However, the growth rate was cut to about half of the previous year's 5.0%.
The reason was that nonfinancial assets, at 23,291 trillion won, rose 3.8%, or 85.7 trillion won, from a year earlier, accelerating from 2.7% the previous year. But net financial assets, at 1,271 trillion won, shrank 20.4%, or 32.6 trillion won, reversing from a 53.8% increase the year before. In the latter case, this was the first decline in five years since 2020, when the figure fell 11.6%, as the growth rate of financial liabilities at 13.6% exceeded that of financial assets at 11.4%.
By factor of change, of the 53.1 trillion won increase in national net assets, transaction factors, or net acquisition of assets, accounted for 31.9 trillion won, while non-transaction factors, such as asset price changes, accounted for 21.2 trillion won. The split was roughly 60 to 40.
The former was driven mainly by the increase in net acquisition of financial assets, which expanded from 11.9 trillion won to 16 trillion won. In contrast, the latter fell far short of the previous year's 83.3 trillion won, as the won-denominated increase in domestic stocks held by nonresidents, or external financial liabilities, outpaced the increase in overseas stocks held by residents, or external financial assets, amid the strong domestic stock market.
Nam said, "Last year's KOSPI rose 4.6 times as much as the S&P 500 and 4.1 times as much as the Euro Stoxx," adding, "This gap caused the increase in financial liabilities to far exceed the growth in financial assets."
By asset type, produced assets totaled 1,057.3 trillion won, up 2.9%, or 30.3 trillion won, from the end of the previous year, while non-produced assets rose 4.6%, or 55.5 trillion won, to 1,271.8 trillion won. Among produced assets, construction assets, equipment assets, and intellectual property products all increased by 2.6%, 4.5%, and 6.4%, respectively. Among non-produced assets, land assets posted the highest growth rate at 4.6%.
[email protected] Kim Tae-il Reporter